Case study
Catching a failing transformer before it fails
Predicting Electrical Transformer Failure Risk
Which distribution transformers are at elevated risk of failure, based on load, lightning exposure, network characteristics, and connection type. A portfolio analysis on a public 15,873-transformer dataset.
- Classification
- Logistic Regression
- Naive Bayes
- Random Forest
Electrical distribution utilities carry thousands of transformers and no way to physically inspect all of them every year. This piece builds and compares three statistical models, logistic regression, Naive Bayes, and Random Forest, to estimate which transformers are most likely to fail within a year, using only data a utility already records: load, lightning exposure, network characteristics, and connection type. Full methodology, results, and limitations are documented in the report below.
Transformers analyzed
15,873
public 2019 cross-section
Historical failure rate
5.08%
807 of 15,873 units
Failures caught (recall)
42.9%
best model, held-out test set
False alarm rate
3.6%
of healthy test transformers
Model fit (F1)
0.409
best model, vs. 0.188 weakest
Ranking ability (AUC)
0.851
0.5 = random, 1.0 = perfect
Dataset from a Colombian utility, used as a public stand-in for utility asset risk modelling methodology; the findings describe patterns in this specific dataset, not a claim about any Canadian utility's actual equipment.
The Question
- Which transformers in a distribution network are more likely to fail within a year?
- Can load, lightning exposure, and network characteristics predict that risk before failure happens?
- How do three different statistical approaches, including a nonlinear ensemble model, compare on the same imbalanced, real-world dataset?
What Was Built
- Cleaned and audited 15,873 transformer records across 16 recorded characteristics, with every judgment call logged before any modelling code was written.
- Explored distributions, class separation, and correlation structure before choosing a model family.
- Built logistic regression and Naive Bayes on an identical feature set first, specifically to demonstrate the cost of Naive Bayes' independence-assumption violation.
- Added Random Forest afterward, once an initial benchmark check showed both linear models trailing a published result, as a best-effort nonlinear comparison on the full predictor set.
- Tuned each model's decision threshold on training data only, then tested all three once on data held back until the end.
What It Found
- Random Forest, the strongest of the three models, flags 43% of true failures while keeping false alarms to about 4% of healthy transformers.
- A companion logistic regression model is less accurate but directly interpretable: longer power line networks and higher local lightning activity are both associated with meaningfully higher failure risk.
- Naive Bayes was kept on the same feature set as logistic regression and performed markedly worse once correlated predictors were added, a deliberate, disclosed illustration of what an assumption violation costs.
- A published support vector machine study on this exact dataset reaches 52-56% recall; adding a nonlinear model narrowed that gap from 11-15 points down to 9-13 points, with one remaining, disclosed next step (resampling the training data).
The Analysis, in Full
Distributions, class separation, correlation structure, model comparison, and diagnostics, exactly as reviewed before any conclusion was drawn.
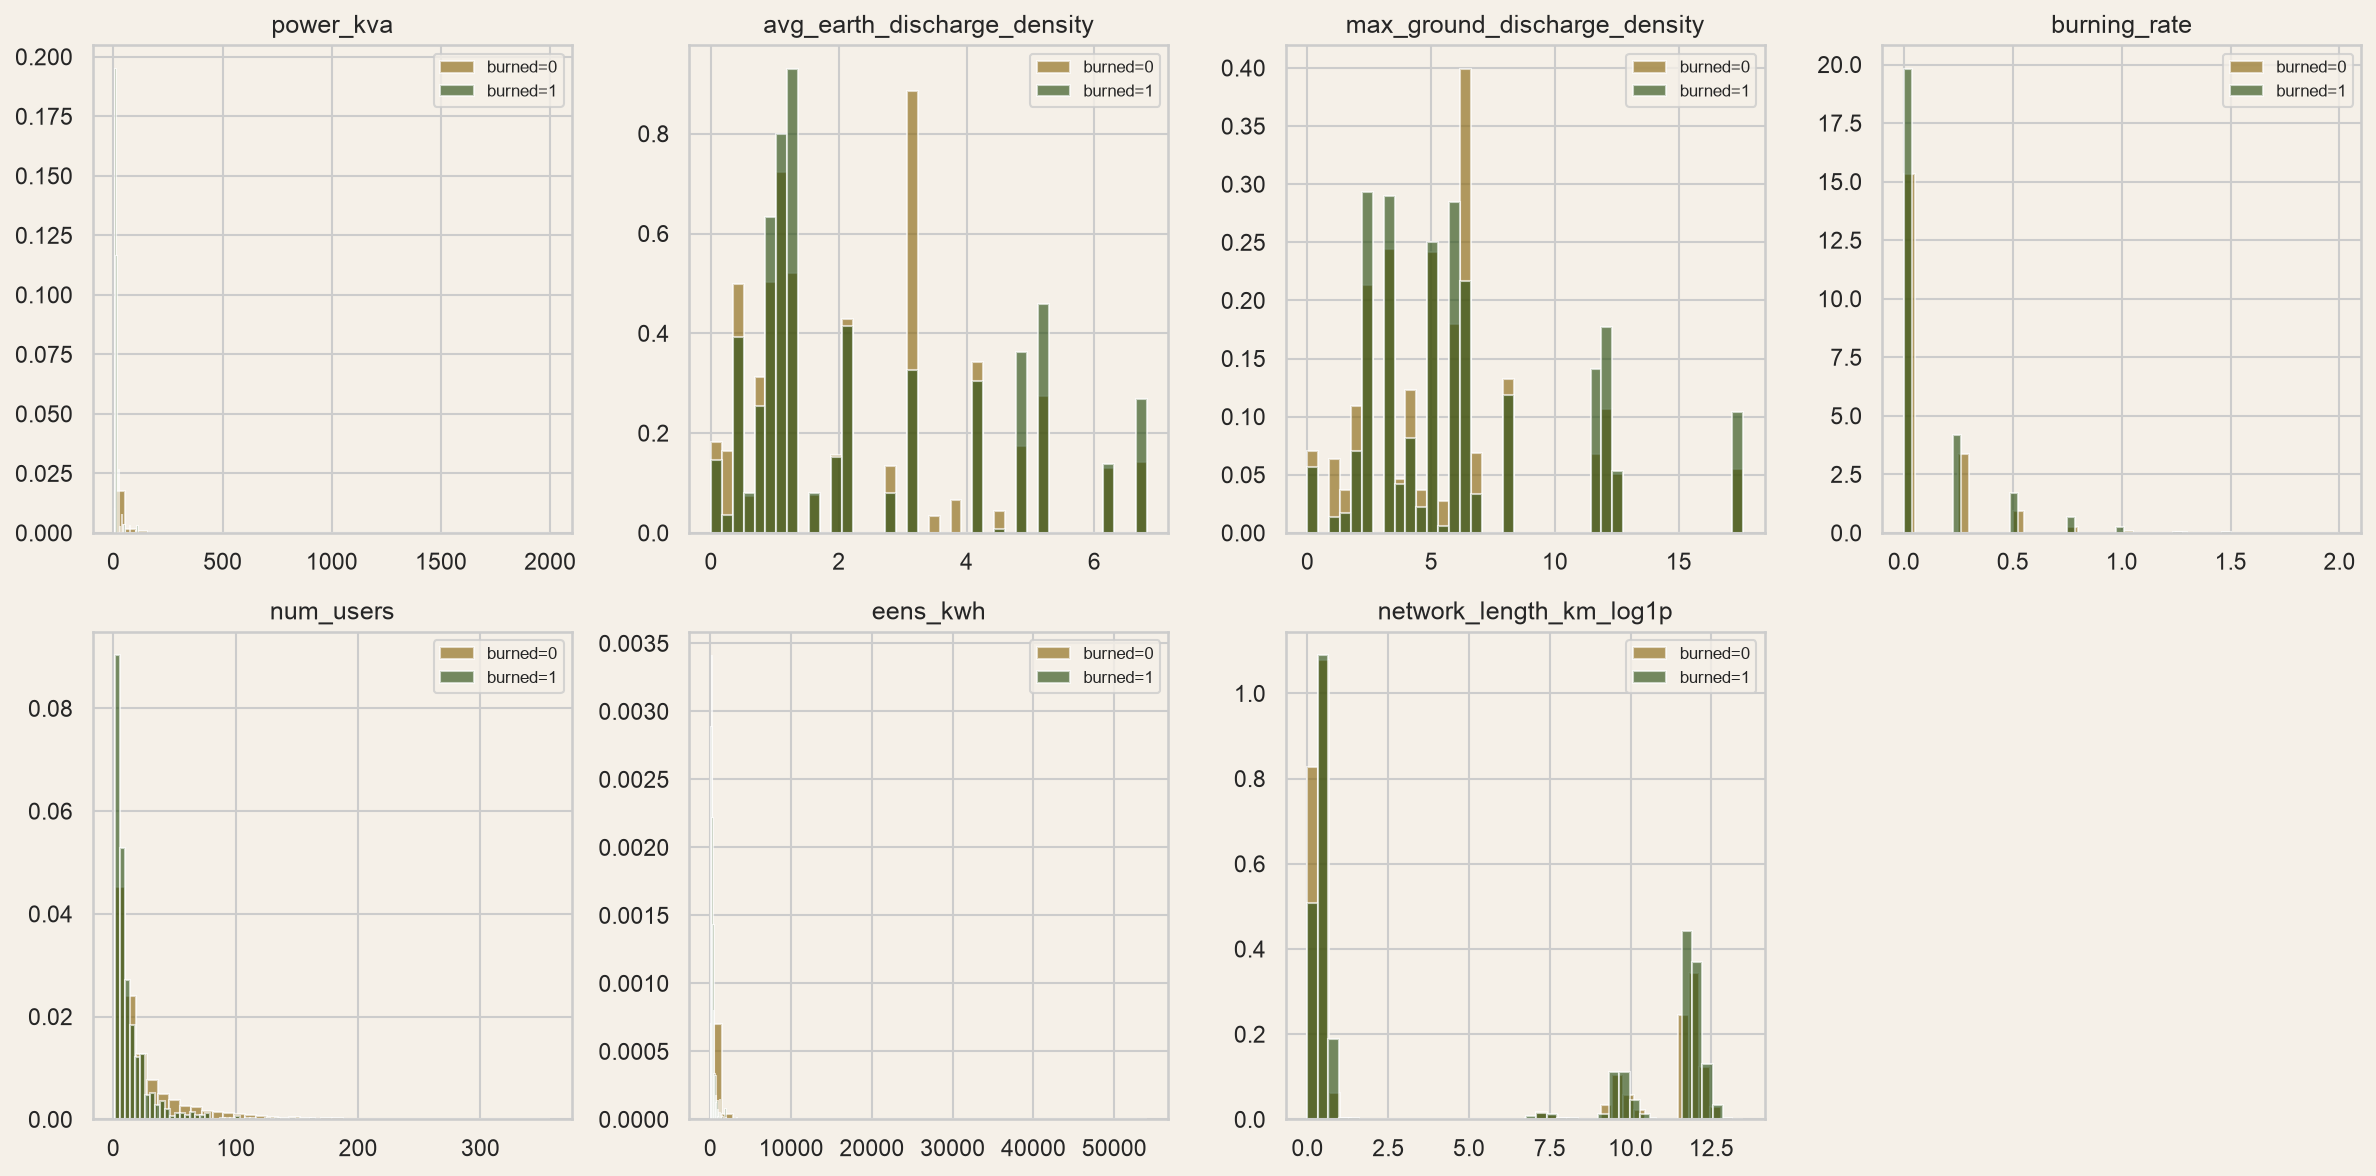
Figure 1. Distribution of continuous predictors, split by failure status.
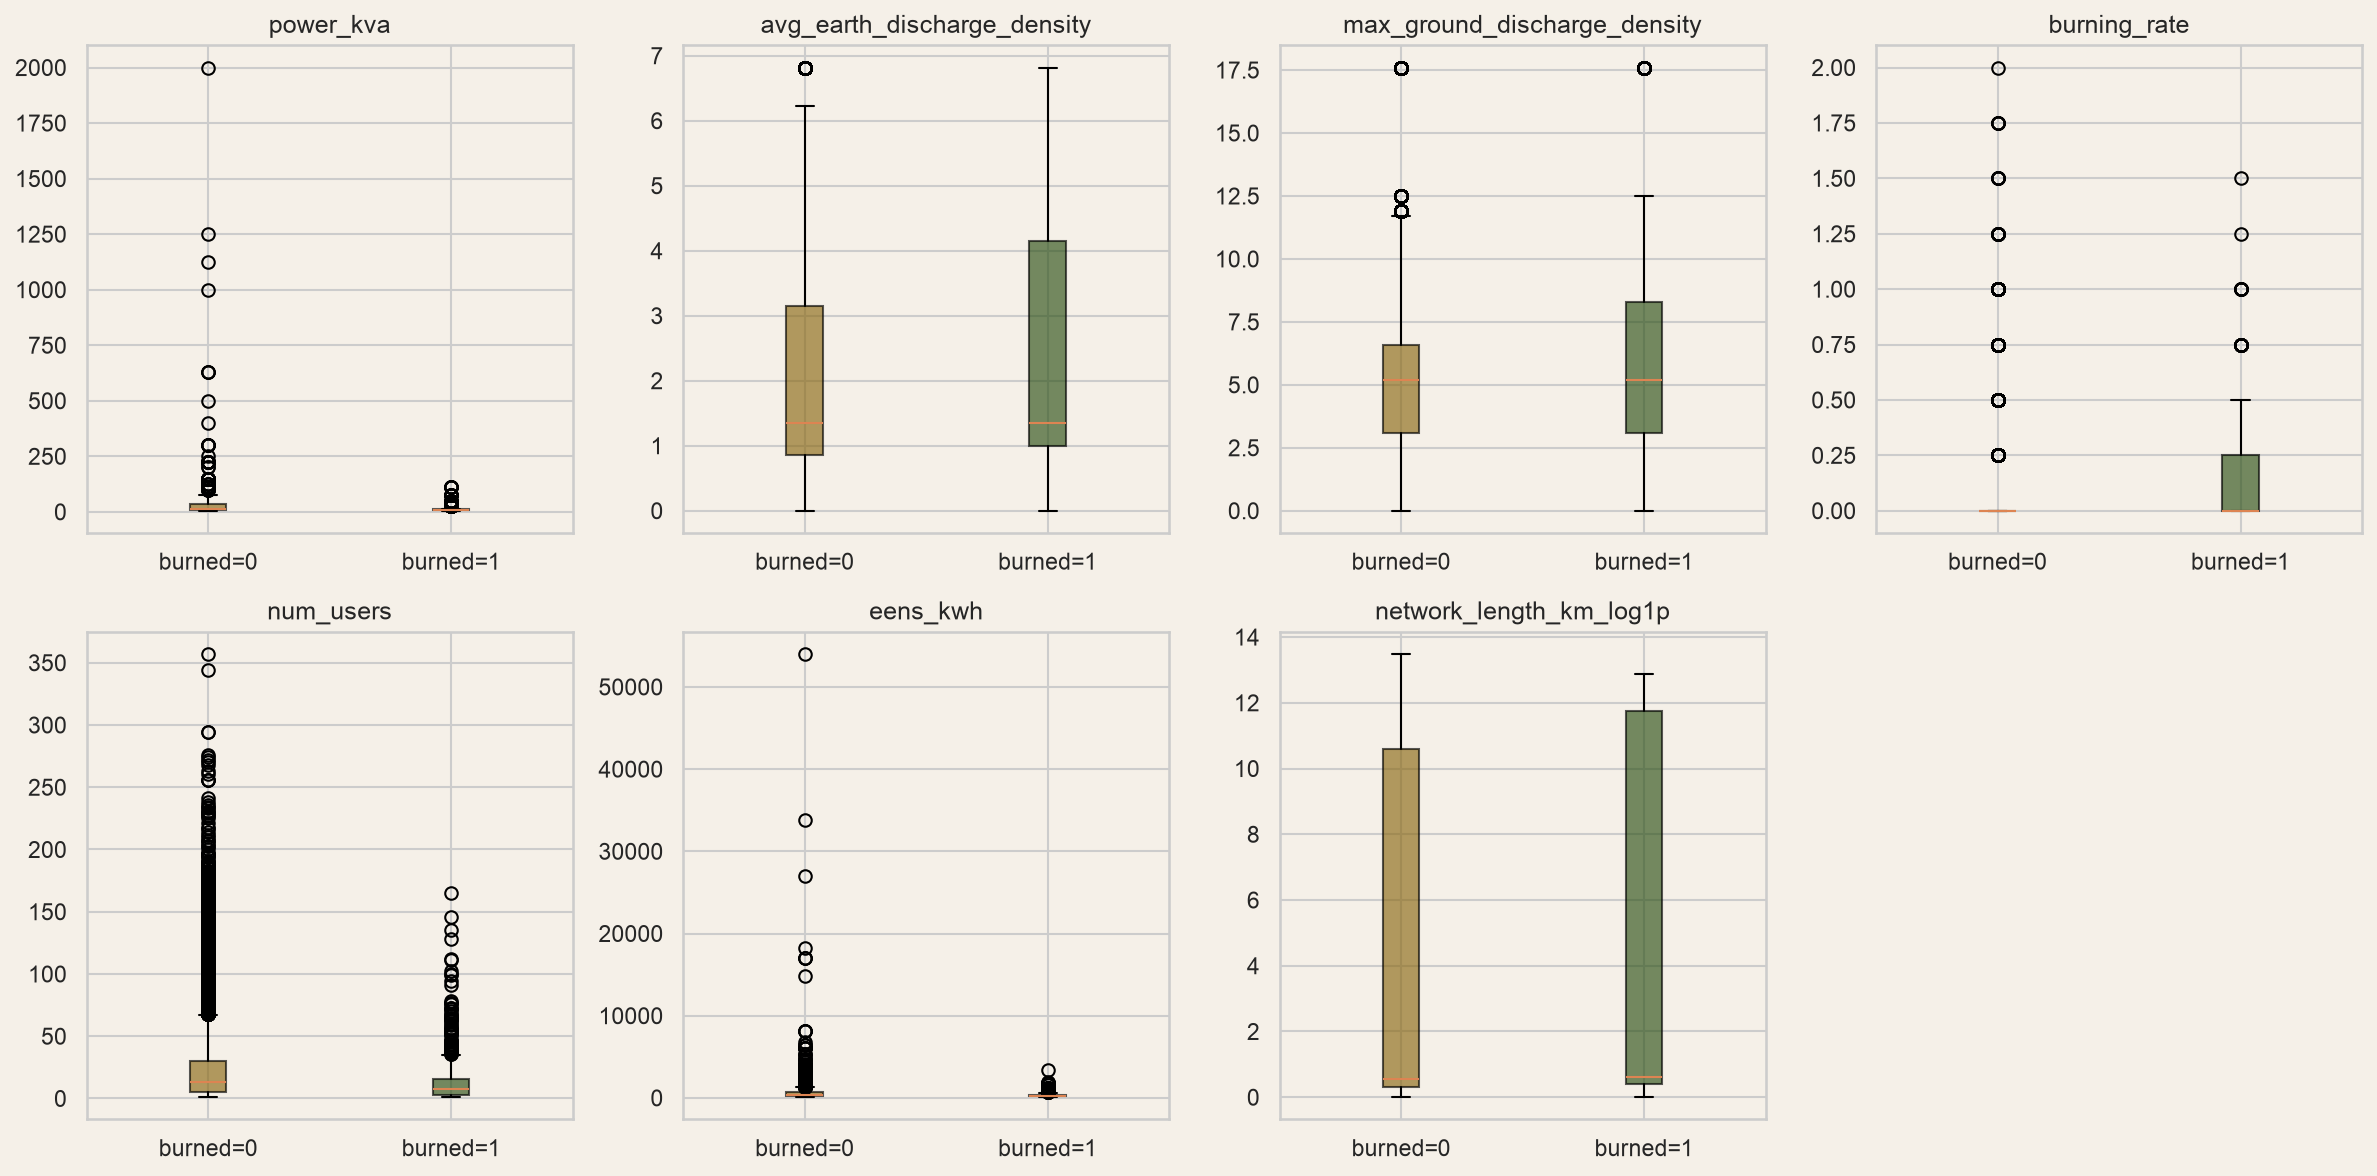
Figure 2. Box plots of continuous predictors, split by failure status.
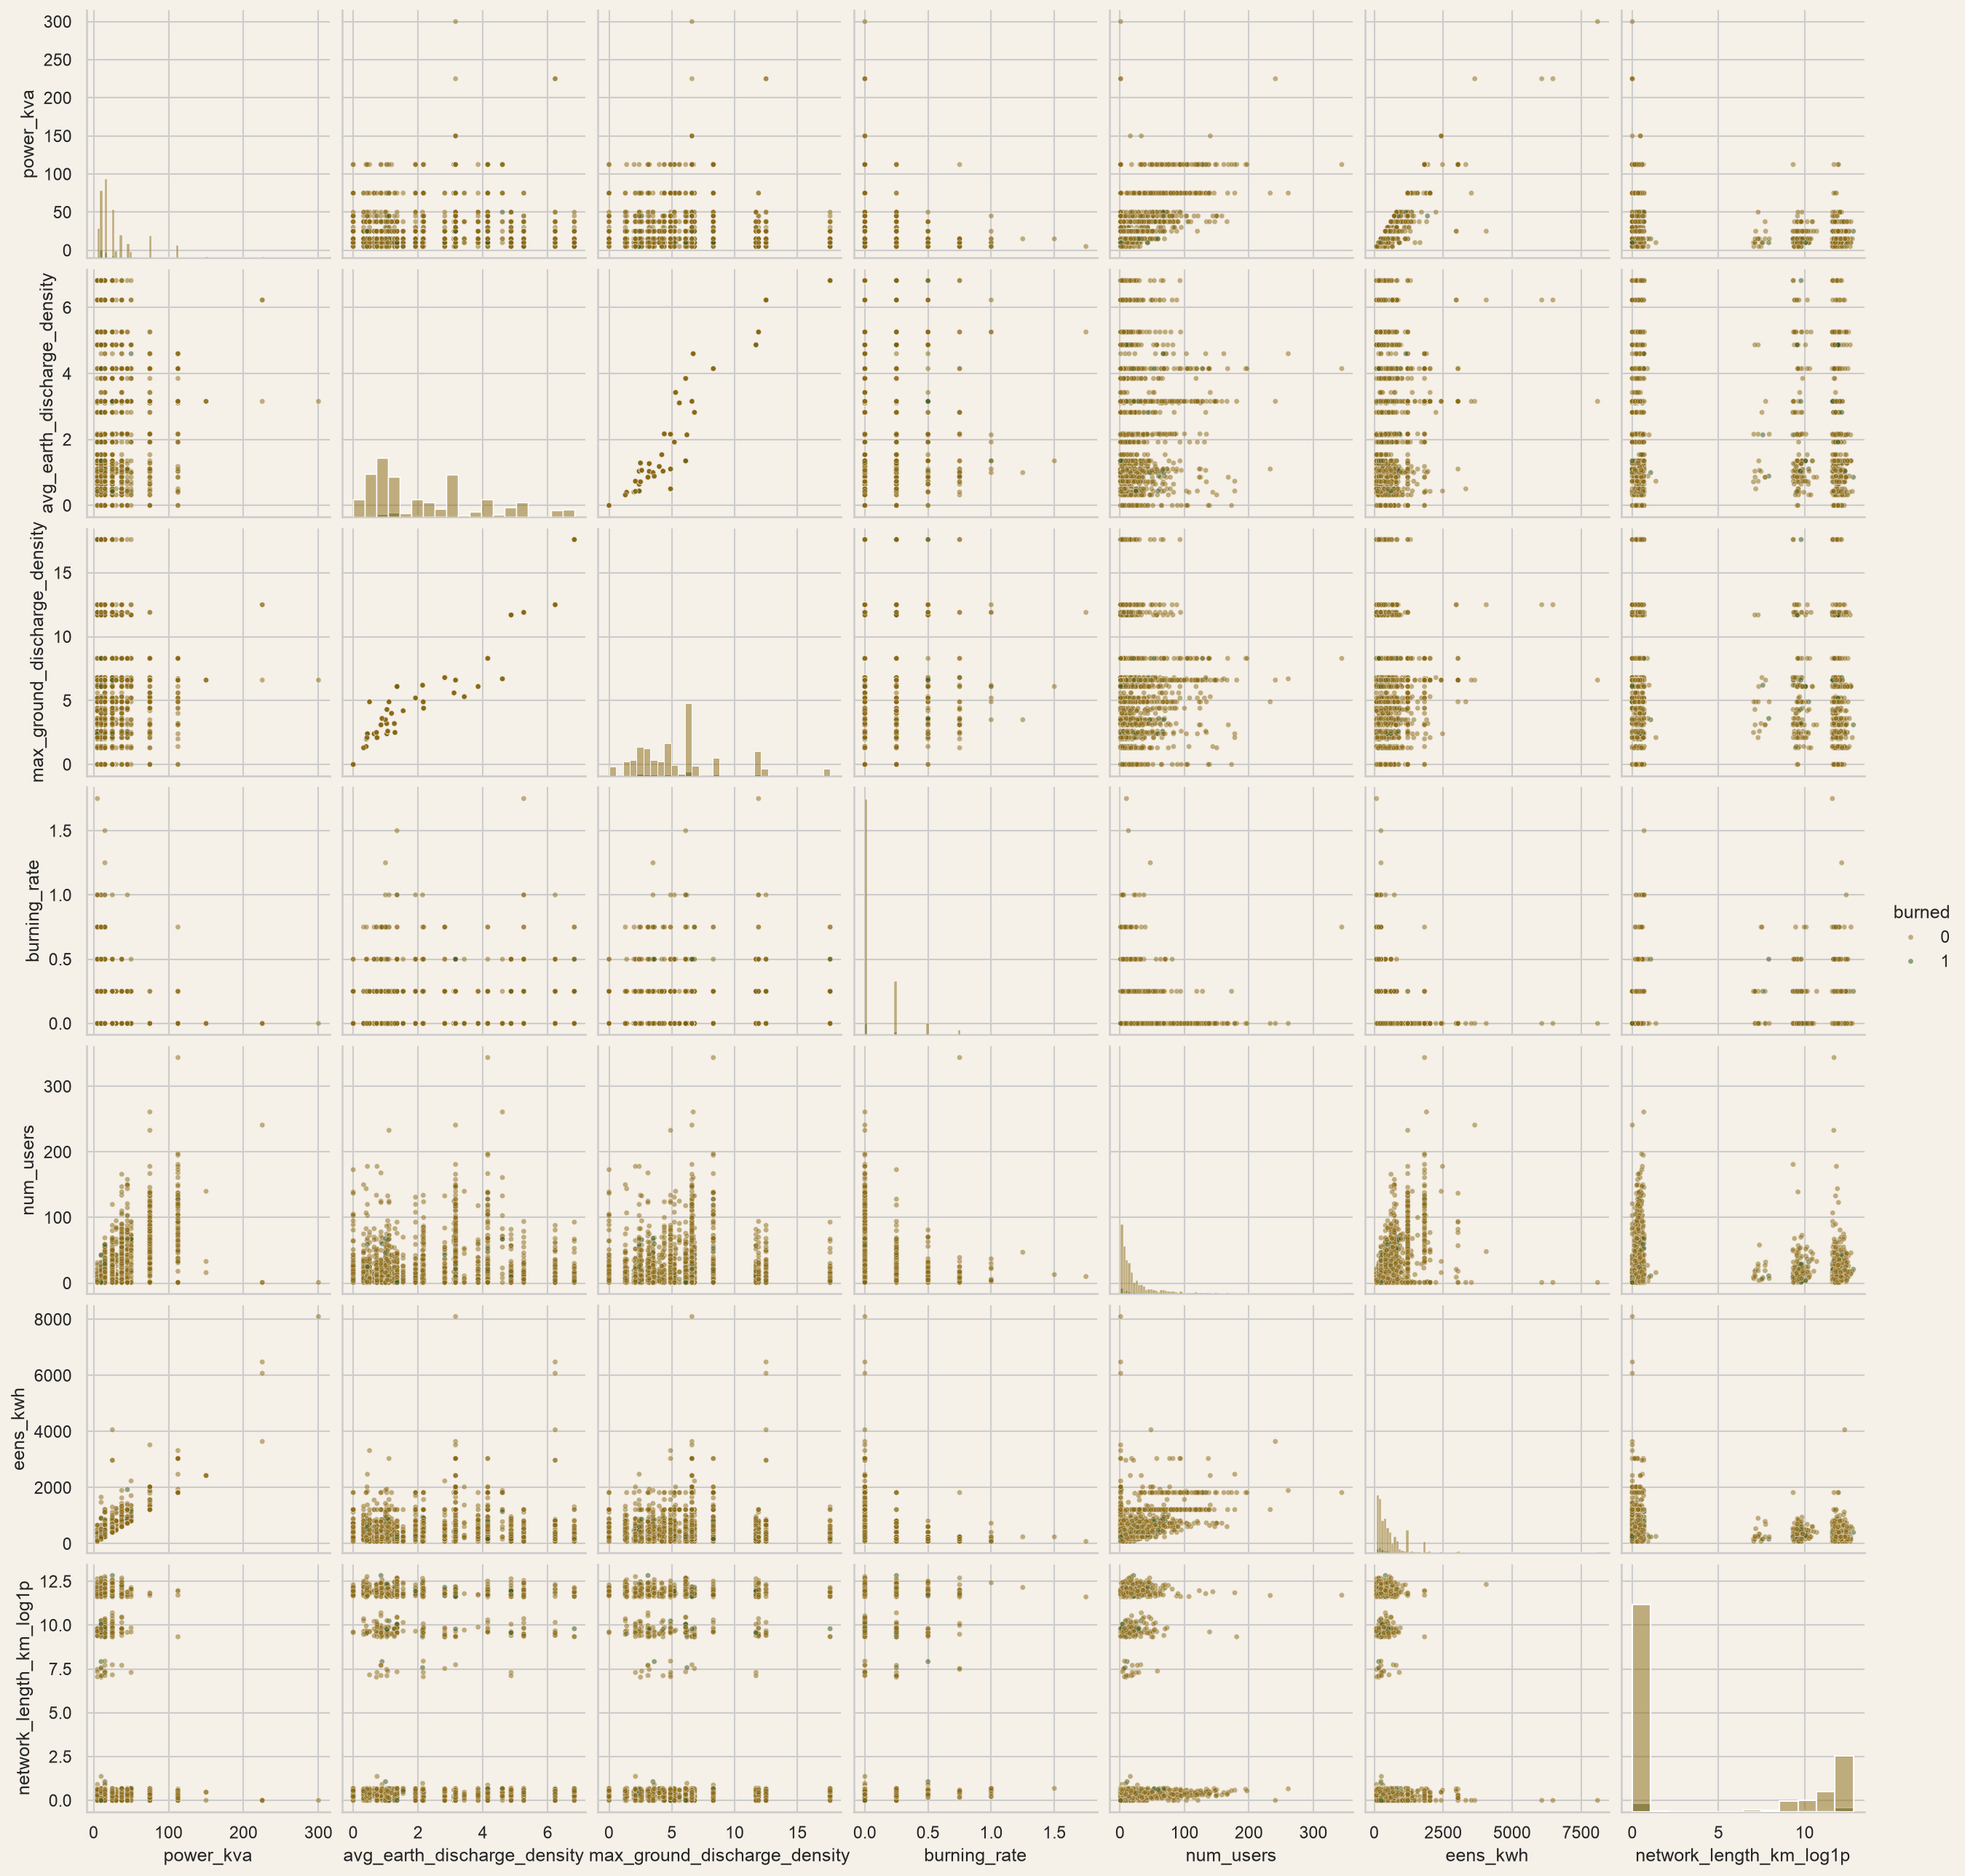
Figure 3. Scatterplot matrix of continuous predictors, split by failure status (2,000-row subsample).
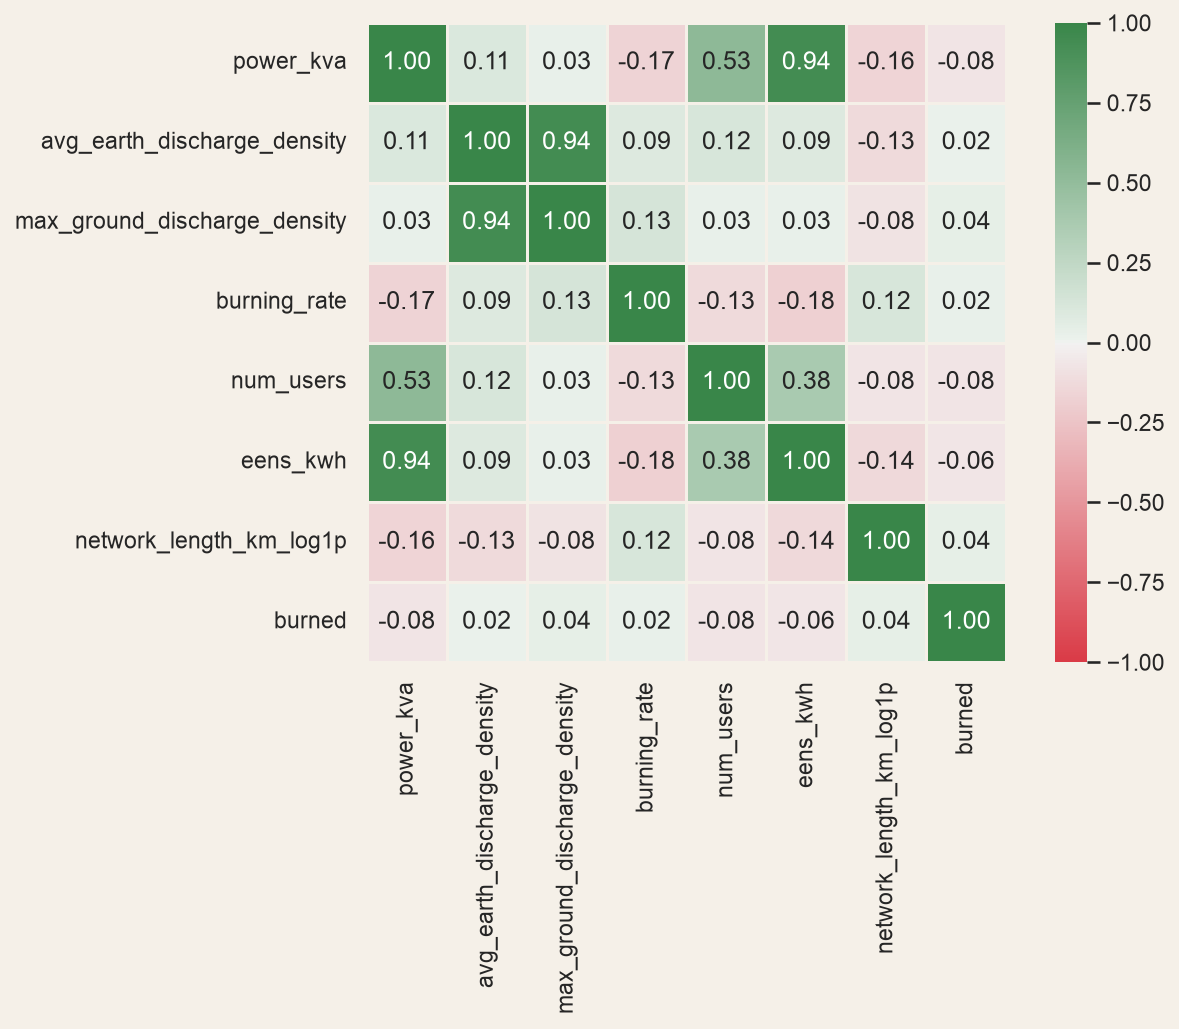
Figure 4. Correlation matrix, continuous predictors and the failure outcome.
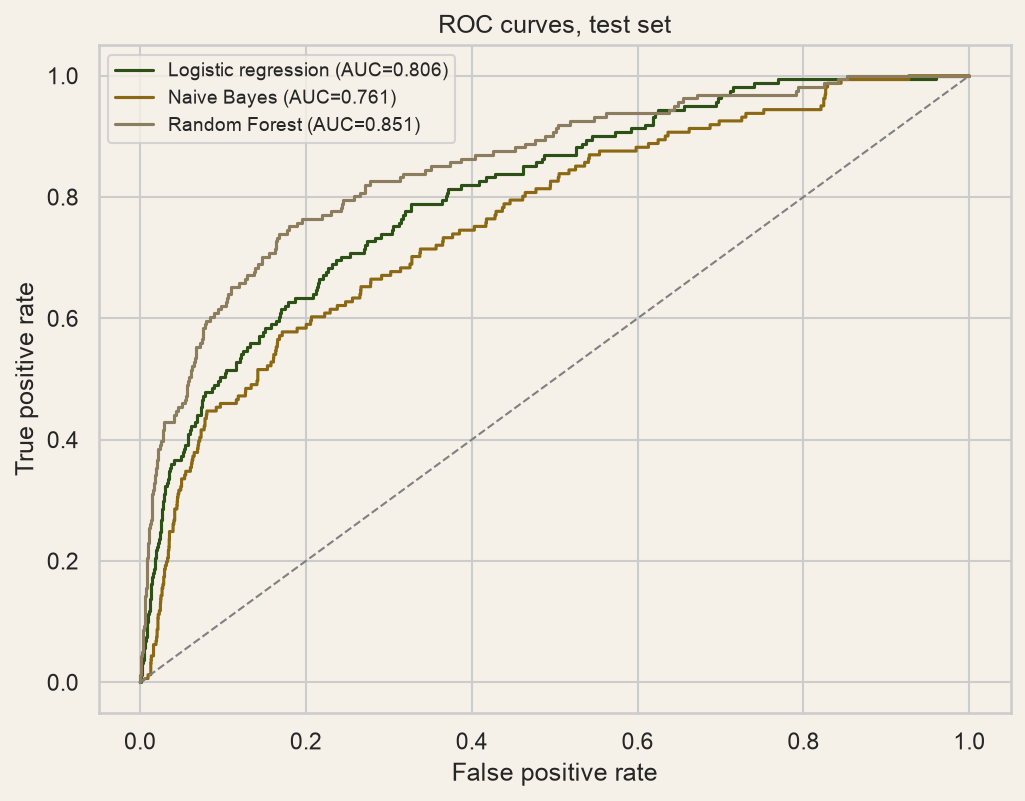
Figure 5. ROC curves for all three models, test set.
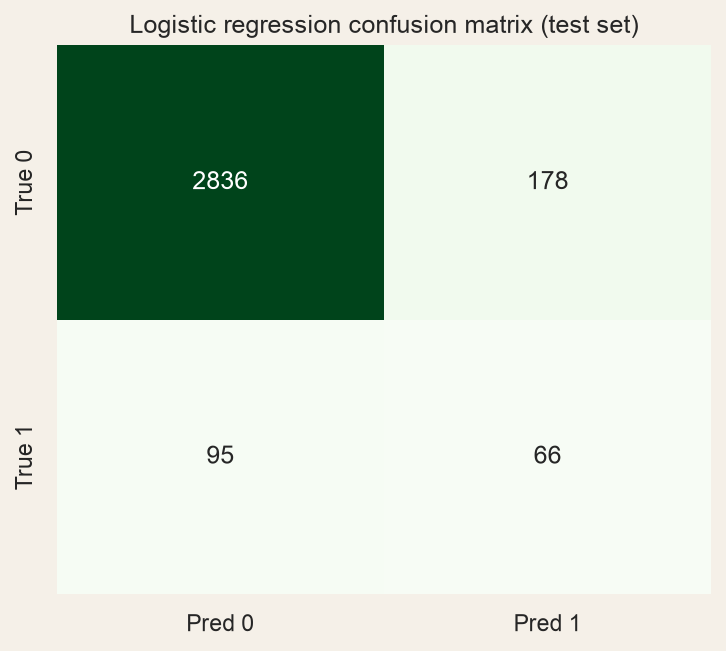
Figure 6. Logistic regression confusion matrix, test set.
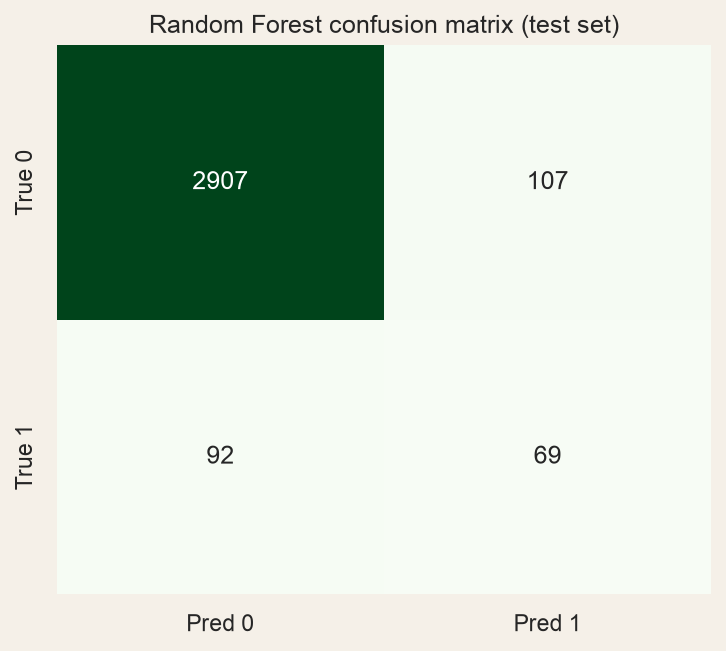
Figure 7. Random Forest confusion matrix, test set.
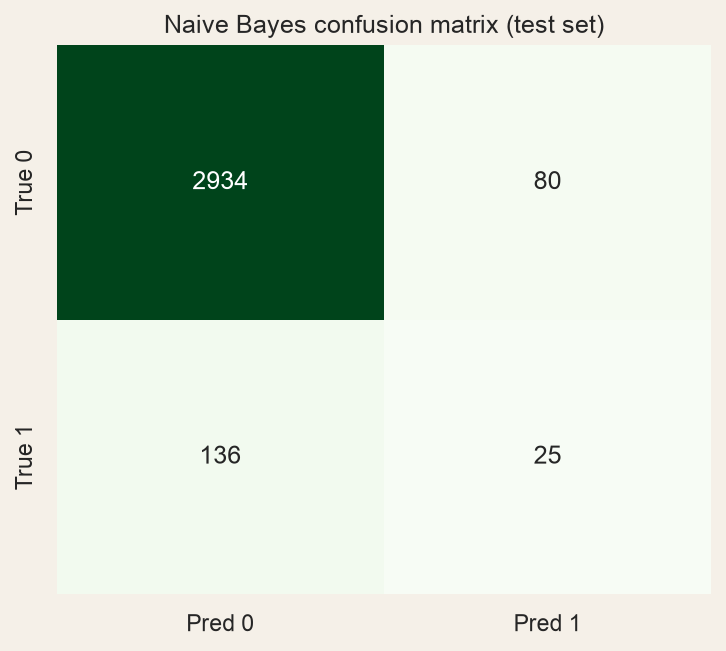
Figure 8. Naive Bayes confusion matrix, test set.
Stack
- Python
- pandas
- NumPy
- scikit-learn
- Logistic Regression
- Gaussian Naive Bayes
- Random Forest
- matplotlib
- seaborn
Read the Full Report
The full report (17 pages) covers data cleaning, variable-role decisions, exploratory analysis, model design, an incremental feature-block comparison, final test-set performance for all three models, a benchmark comparison against published literature on this exact dataset, and a full disclosed limitations section.
Download the PDF reportThis case study was self-directed. A paid engagement runs the same three steps.