Case study
What a custodian export doesn't tell you
Wealth Management Book-of-Business Audit
Auditing an advisory practice's book of business for true fund diversification, direct preferred-share exposure, and household-concentration risk, three structural questions a raw holdings export cannot answer on its own.
- Data Cleaning
- Rule-Based Parsing
- Descriptive Audit
A wealth-management practice's custodian export answers "what do we hold," but not "how diversified are we really," "how much is actually in direct preferred shares," or "where is our concentration risk hiding." This piece builds a deterministic, fully auditable rule-based audit answering all three, on a fully synthetic dataset built to match the structure of a real advisory book of business. Full methodology, results, and limitations are documented in the report below.
Positions audited
331
synthetic holdings export, 12 asset types
Raw fund series
36
before consolidation
True fund count
24
33% fewer than the raw series count
Direct preferred AUA
$2.61M
after excluding fund-wrapped products
Held by 1-2 households
$30.1M
143 non-GIC positions
Non-GIC positions thinly held
77.8%
fewer than 4 households
Fully synthetic dataset, generated to match the structure of a real advisory book of business; no real client, advisor, or firm data appears anywhere in this analysis.
The question
- How many distinct funds does a book actually hold, once the same fund's no-load and front-end-load "series" are counted as one?
- How much is genuinely in direct preferred shares, once mutual funds that merely invest in preferred shares are excluded?
- How much of the book sits in positions held by only 1 or 2 households, a concentration signal no single-position report surfaces?
What was built
- Audited a 331-position holdings export across 12 asset types, logging every cleaning and scoping decision before writing analysis code.
- Built a deterministic, auditable rule-based parser to strip load-code and series-class suffixes and recover each position's true underlying fund.
- Extracted issuer tickers from preferred-share symbols and separated direct holdings from fund-wrapped preferred-yield products.
- Filtered and cross-tabbed thinly-held positions (fewer than 4 households, ex-GICs) against risk rating to surface a suitability/concentration lens.
What it found
- True fund count (24) is 33% lower than the raw series count (36), a discrepancy invisible in any standard custodian report.
- A clean direct-preferred-share total ($2.61M) separated from $667K of fund-wrapped preferred-yield products the custodian's own asset-type tag conflates with it.
- $30.1M held by only 1-2 households, cross-tabbed by risk rating to flag where thin holding and elevated risk overlap most.
- Every raw security name traced to its consolidated true fund in a fully auditable mapping file, not a black-box result.
The analysis, in full
Distributions, fund-series consolidation, preferred-share breakdown, and household-concentration cross-tabs, exactly as reviewed before any conclusion was drawn.
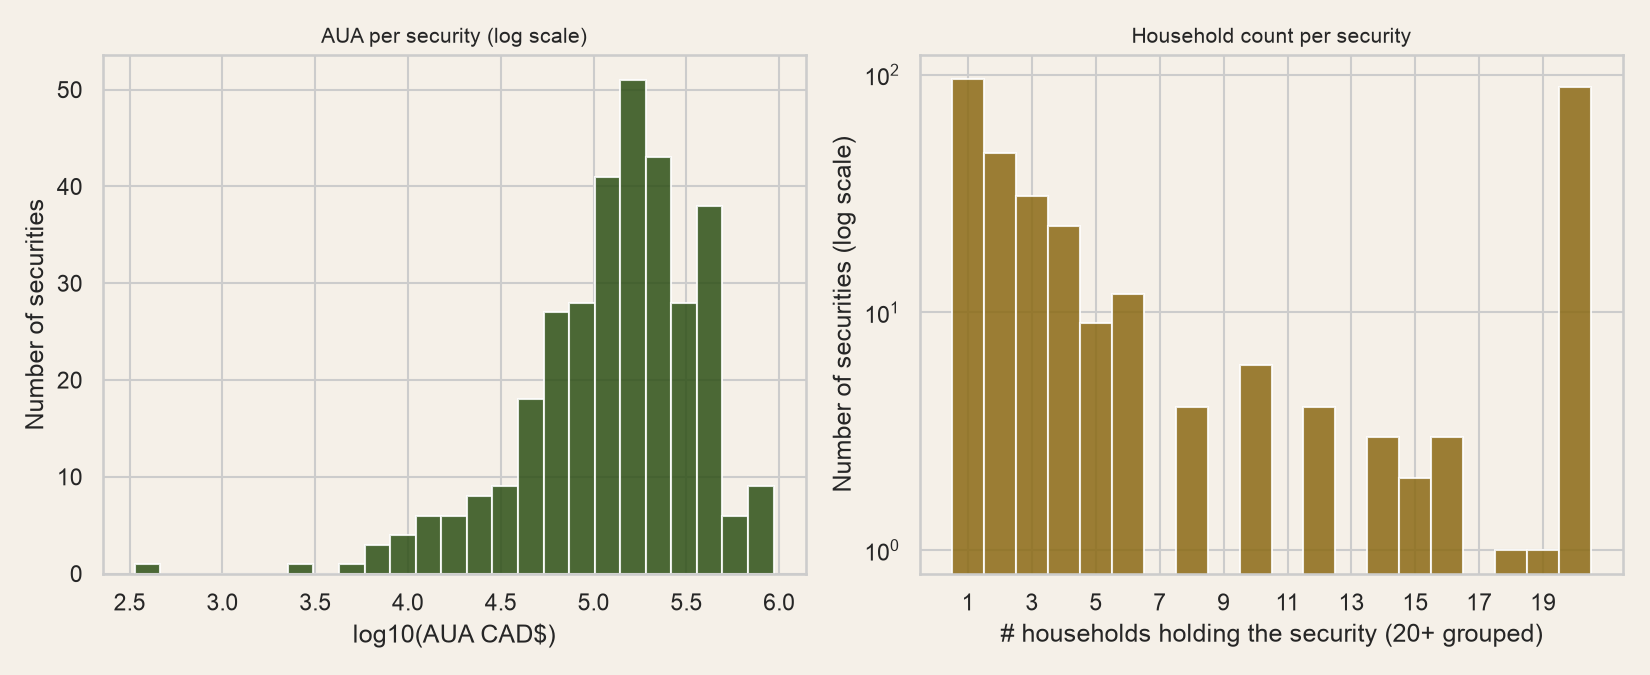
Figure 1. AUA and household-count distributions.
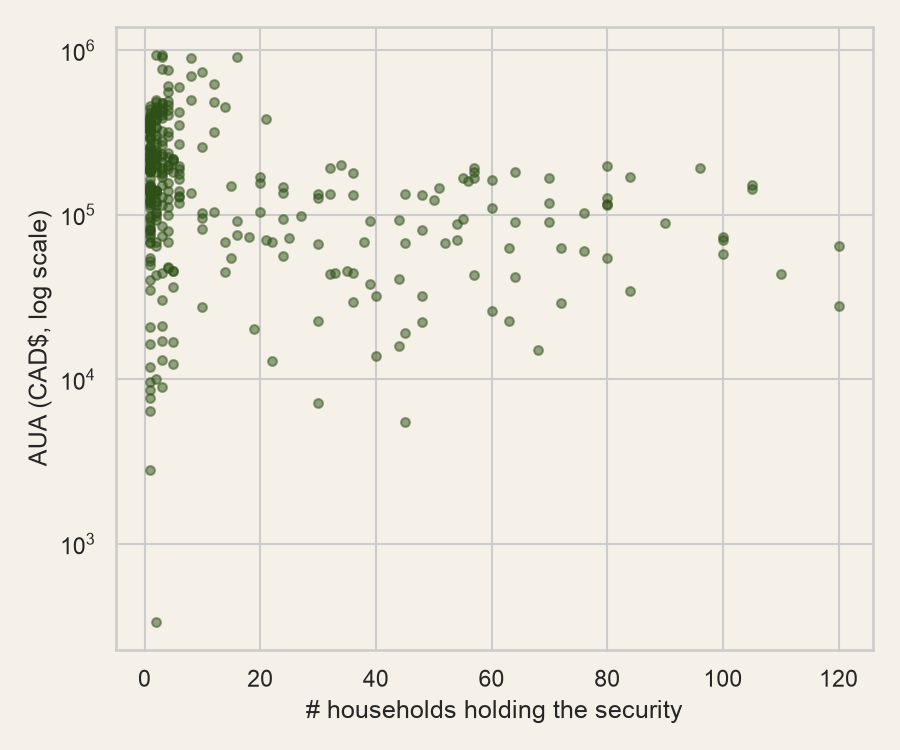
Figure 2. AUA vs. household count.
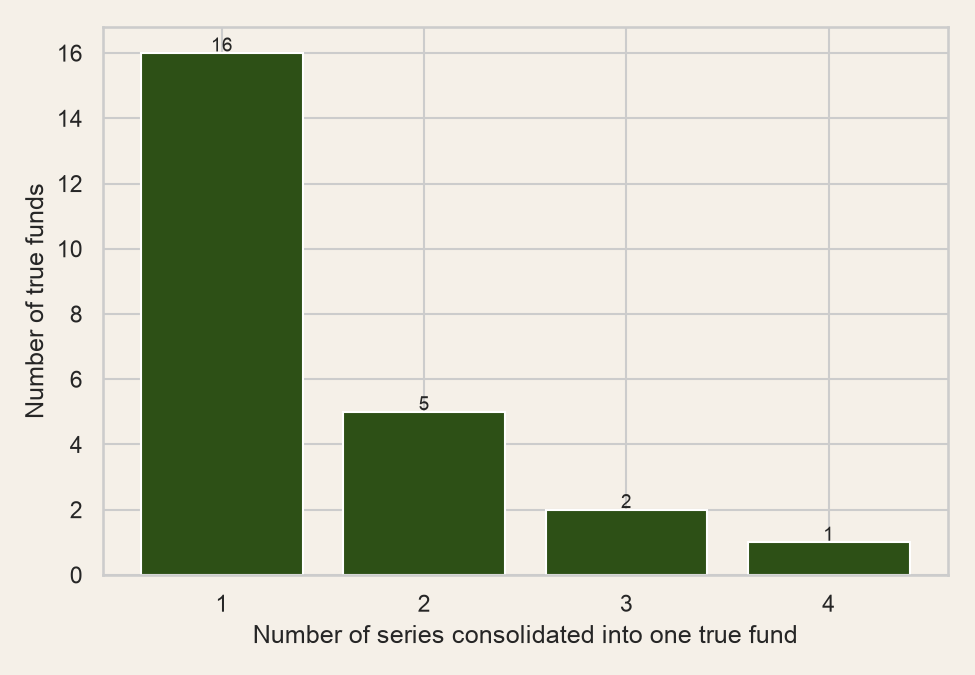
Figure 3. Distribution of series consolidated per true fund (Q1).
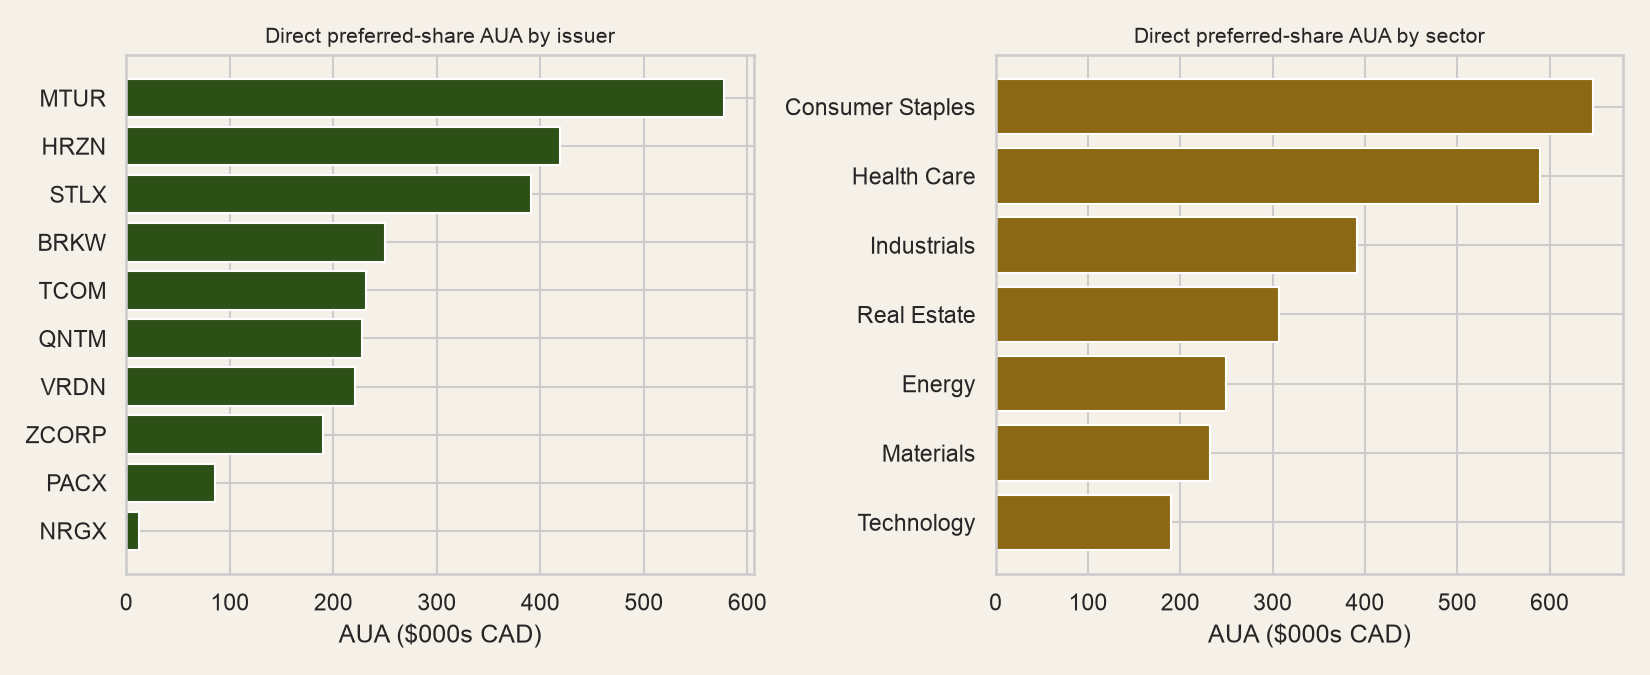
Figure 4. Direct preferred-share AUA by issuer and by sector (Q2).
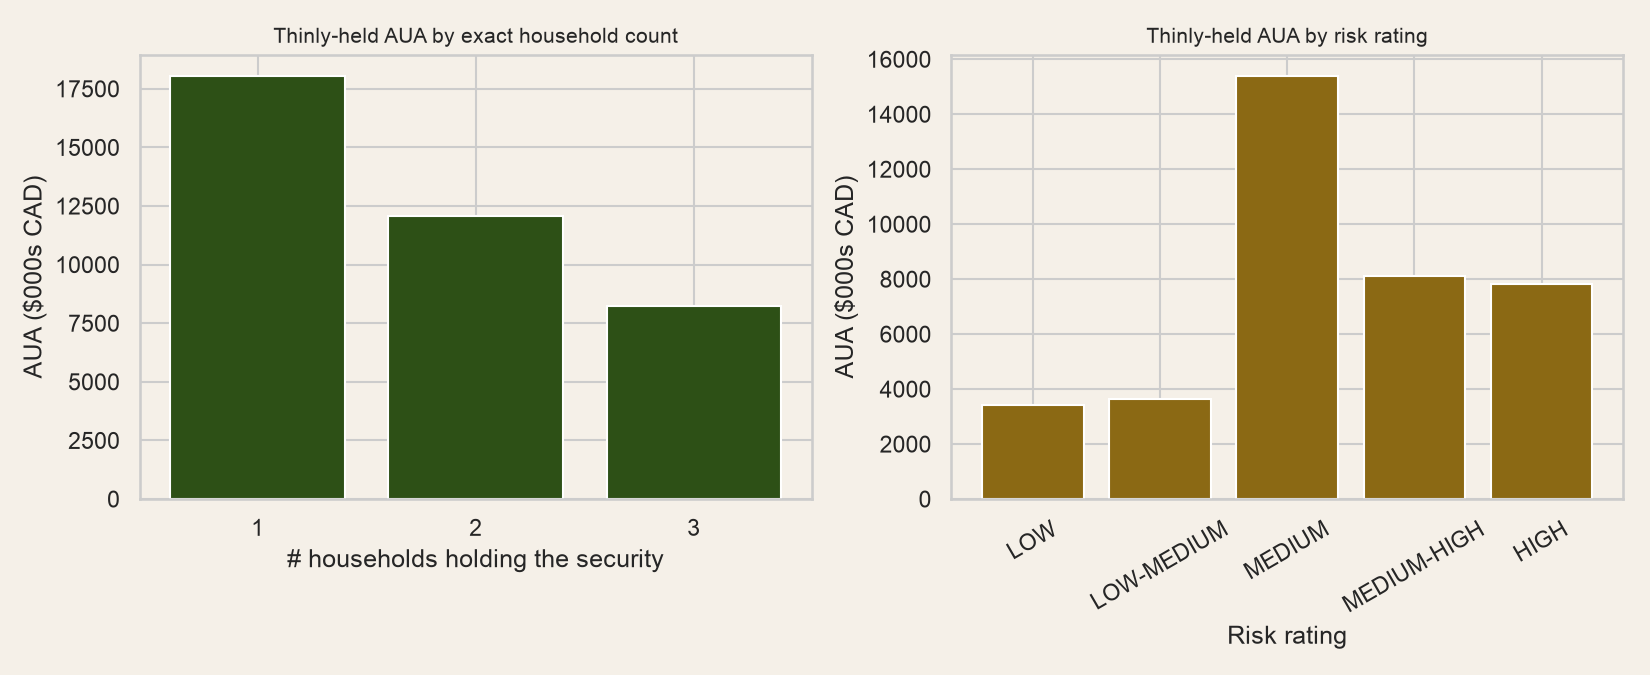
Figure 5. Thinly-held AUA by household count and by risk rating (Q3).
Stack
- Python
- pandas
- NumPy
- Regular expressions
- matplotlib
- seaborn
Read the full report
The full report covers the reason a synthetic dataset was used, data structure and cleaning, exploratory analysis, the fund-series consolidation methodology, the preferred-share issuer/sector breakdown, the household-concentration cross-tab, and a full disclosed limitations section.
Download the PDF reportThis case study was self-directed. A paid engagement runs the same three steps.